Projects
Browse data visualisations, TEBOs, and sense-making experiences.
These are from my work in the football/education industries — I've also worked across other sectors, but those projects aren't currently accessible for public sharing. More examples will be available soon, or get in touch if you'd like to see more.

Perfect Square
Multivariate Data Comparison & Grouping Tool
The Perfect Square visualises high-dimensional data as a square that fills toward an ideal target state. Compare thousands of profiles at a glance, then zoom in for detailed KPIs. Useful for rehabilitation monitoring, recruitment profiling, and seeing vector similarity for LLM tokens.
Built with React, TypeScript, D3, and Next, with data fetched via GraphQL from a Node server (with Python analytics). Performance is optimised in SVG (no canvas) using semantic zoom, virtualised rendering, and D3’s enter–update–exit pattern for efficient updates at scale.
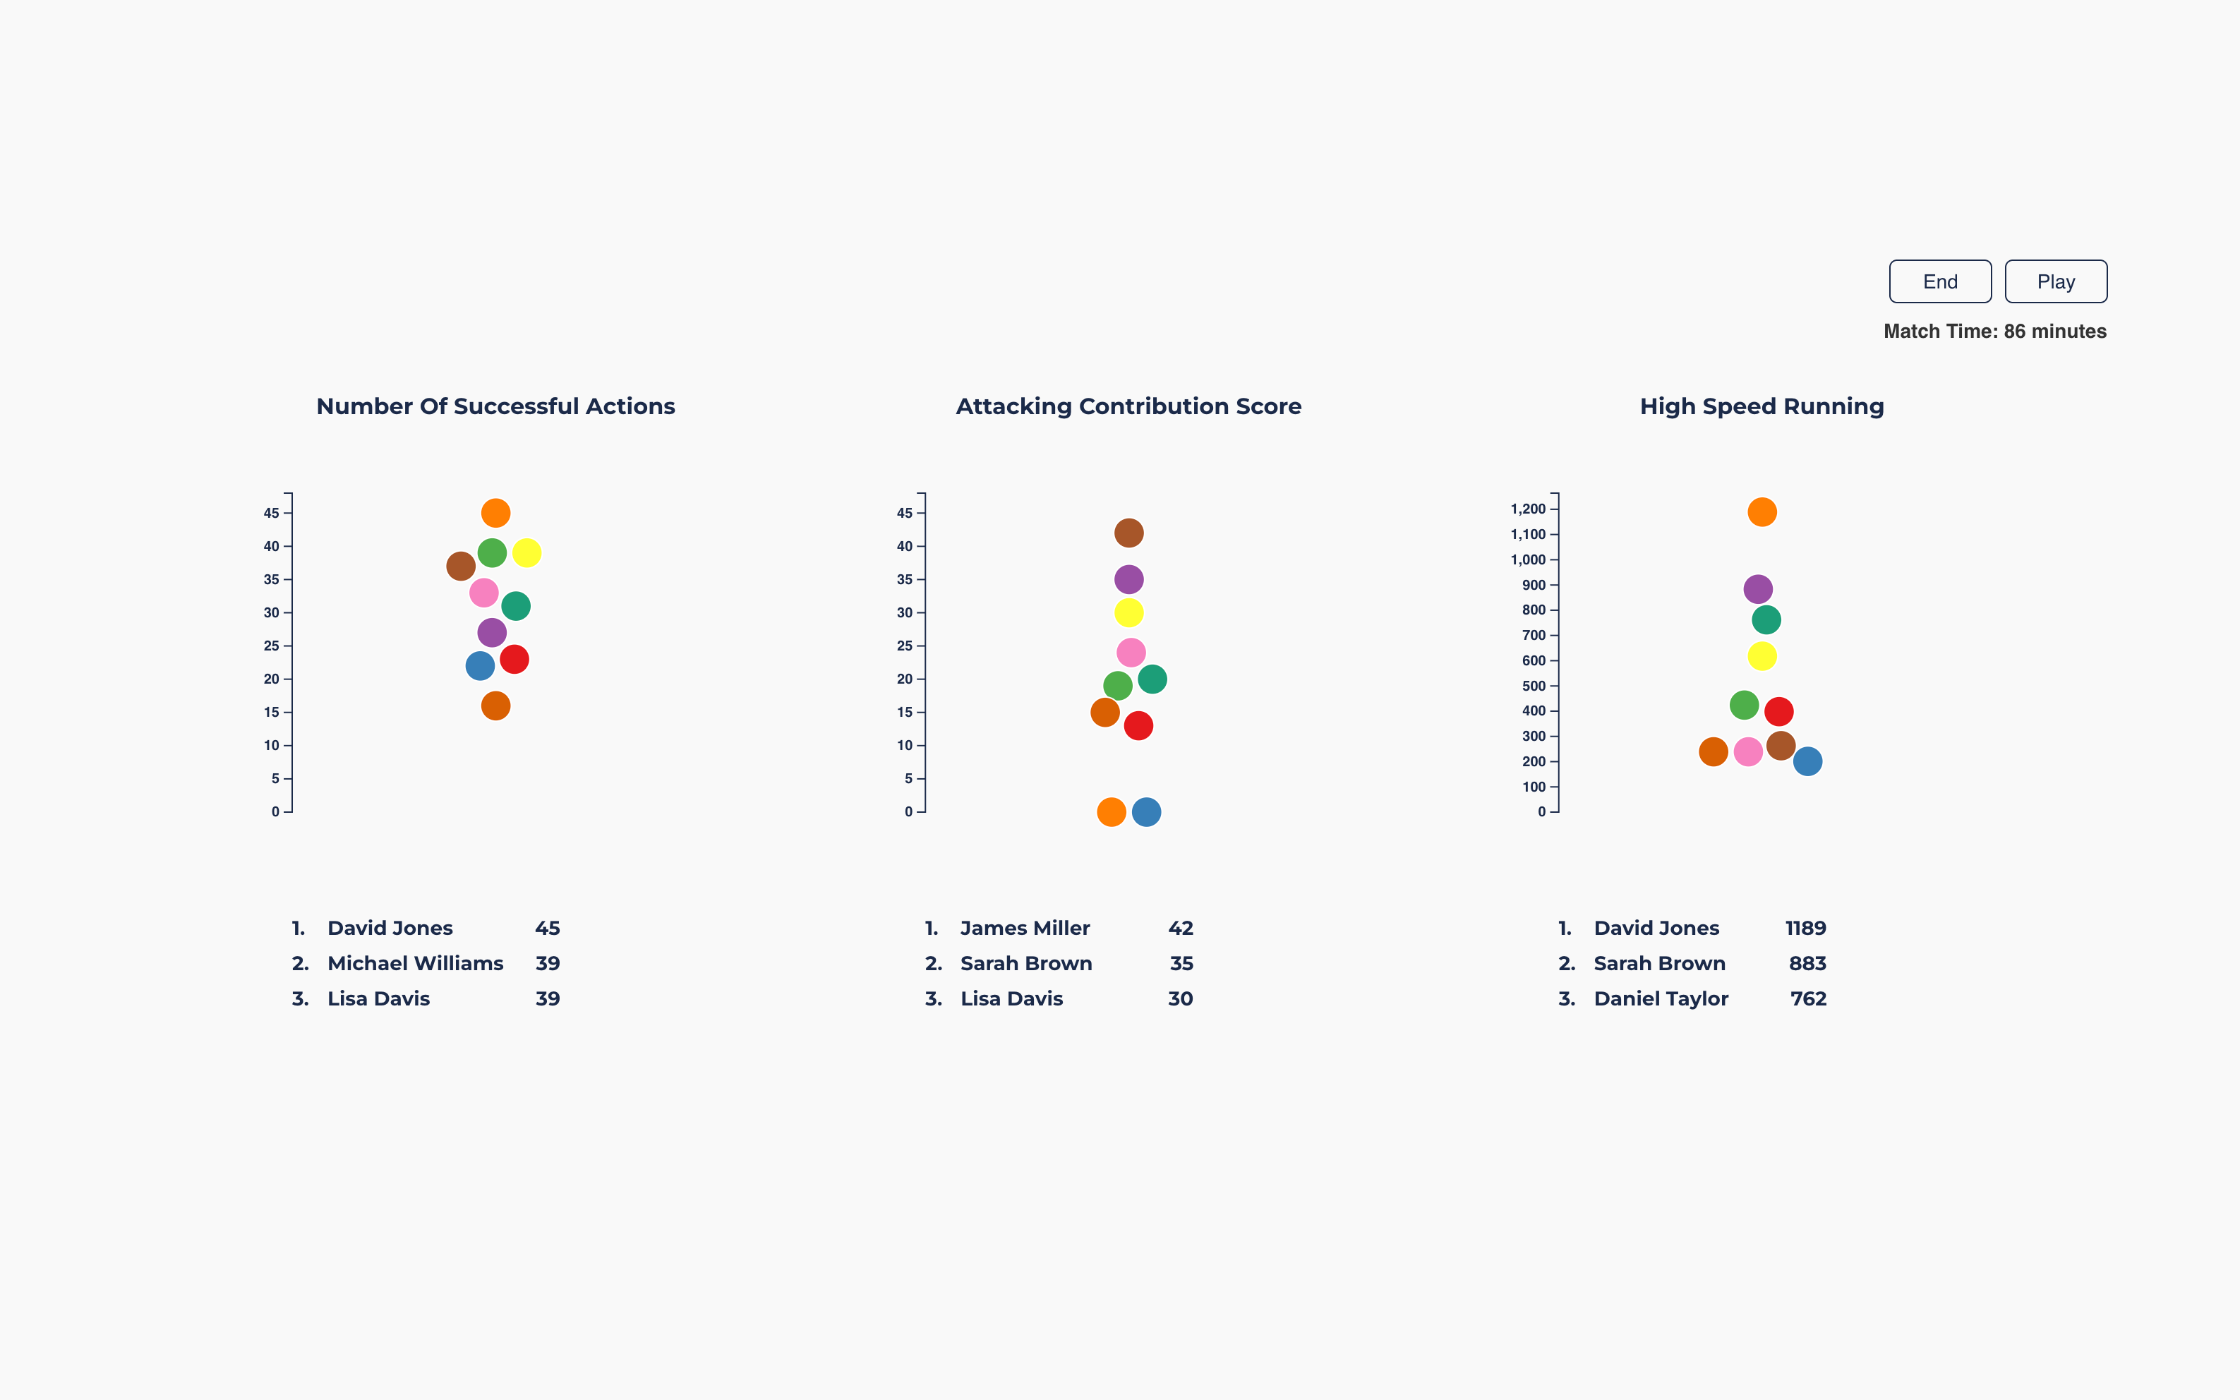
The Race
Animated KPI Race Replay
The Race turns post-match KPIs into a fast animated 'race replay'. As match time advances, cumulative performance changes are felt through overtakes and leads—making improvements and drop-offs obvious. It's a fun, emotional format for reflection and post-match discussion.
Particularly effective for tracking progress over time across multiple entities, this visualization style combines clear visual hierarchy with interactive controls, allowing users to explore data at different temporal scales and compare key metrics dynamically.
Beat Maths
Learning TEBO
Beat Maths is a lightweight learning TEBO focused on rhythm and maths.
This placeholder page will evolve into the full interactive experience.
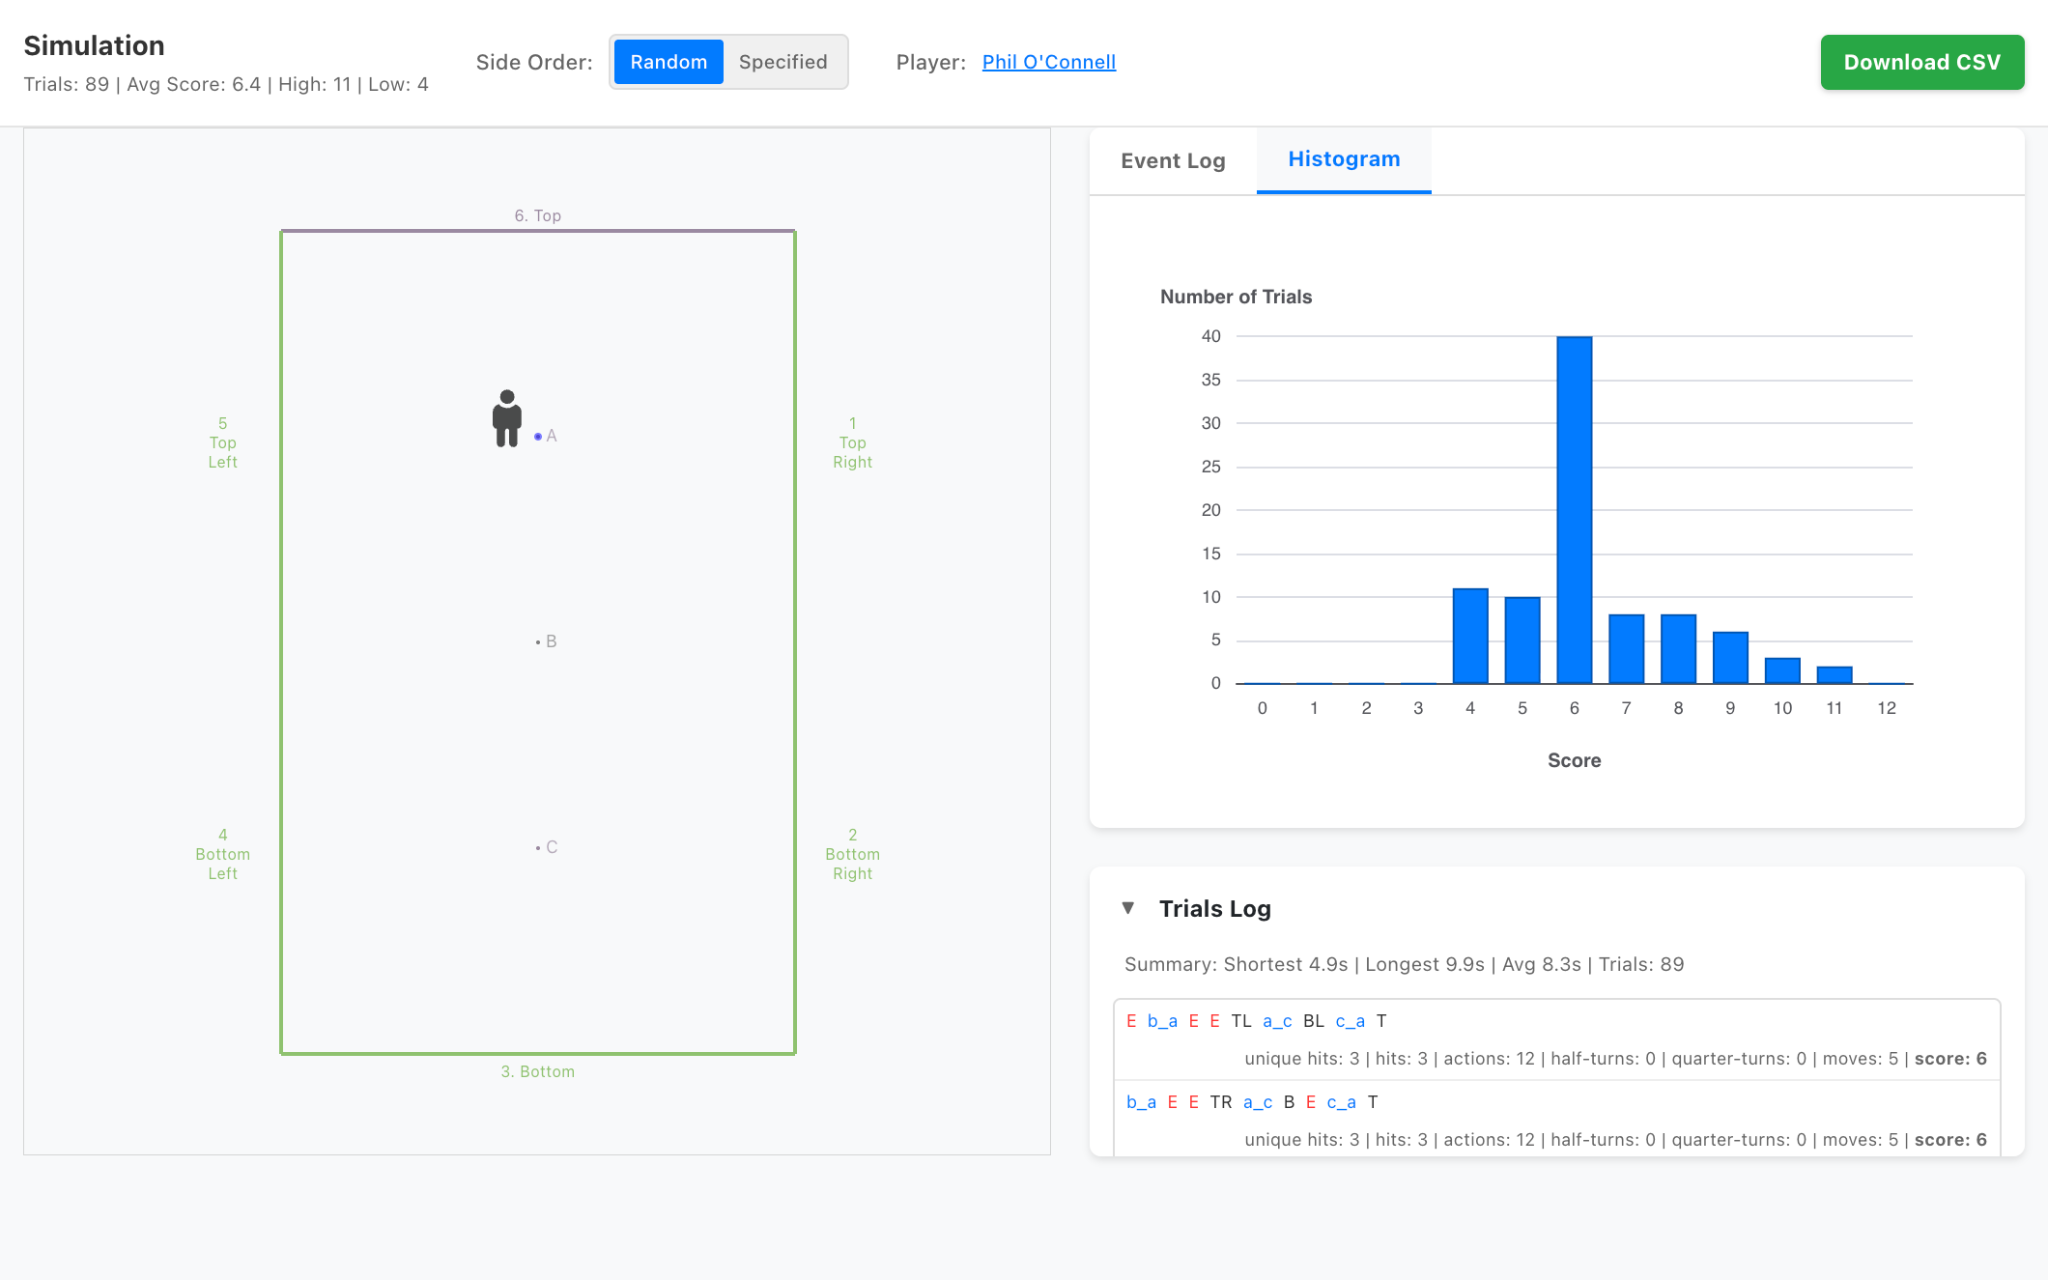
Strategy Sim
AI Sports Strategy Learning Tool (Prototype)
StrategySim is a protoype for a simulation game for young people who play sport to explore strategy through intuition and AI. Players test tactics in a real-world target challenge, then simulate them repeatedly to see what performs best—making sports data science competitive, tangible, and easy to discuss.
The platform integrates real-time strategy simulation, results clustering, and comparative visualization to help learners understand the relationship between tactical decisions and outcomes. Designed for both individual exploration and classroom discussion.