About

What is TEBO Studio?

TEBO Studio is my design-and-build practice for data visualisation and interactive tools.

I turn complex data into clear, explorable interfaces — from high-quality core charts to bespoke visual systems and interactions when off-the-shelf approaches aren't enough.

My background combines frontend engineering (D3/TypeScript/React) with deep strengths in the foundations of data visualisation: information design, UX, visual science, data flow, data literacy & maths education — all focused on helping people understand what the data is really saying.

Alongside product work, TEBO Studio also includes learning-focused tools and experiences, where interactivity becomes a way to develop insight, confidence, and agency.

Jump to what matters most:

What are TEBOs?

TEBO stands for Technology-Enhanced Boundary Object — a term introduced by Celia Hoyles, Richard Noss, and colleagues at the UCL Institute of Education.

A boundary object is something that helps people coordinate understanding across different perspectives — especially when they don't share the same background or language. In practice, this means a boundary object can help someone move between fields: for example, helping a non-specialist engage meaningfully with data, models, or technical reasoning without needing to become an expert in data science.

A TEBO is a boundary object with interactivity: a tool you can explore, manipulate, and learn from. It supports interdisciplinary collaboration by making ideas relatable across roles — so people can question, test, and reason, rather than simply accept what a chart or an expert tells them.

In TEBO Studio, TEBOs bridge the gap between:

  • data and meaning
  • intuition and analysis
  • domain knowledge and technical modelling

Some TEBOs look like visualisations. Some look like simulations. Some look like learning tools. What they share is this: they turn abstract or hidden structure into something people can interact with — and therefore reason about.

The idea connects to sociocultural theories of learning and development: understanding is built through tools, structures, and shared activity.

Why This Matters in Tech Teams

Modern products are increasingly data-driven — but most teams still rely on a small number of specialists to interpret complex data. In reality, most data interfaces already function as boundary objects: they're the place where domain knowledge, technical modelling, and decision-making meet.

Treating these interfaces as TEBOs focuses design on helping non-specialists reason with, challenge, and use data with confidence.

Just as importantly, data visualisation is a specialist craft. Teams often iterate and gather feedback — but dataviz requires a particular lens: knowing what questions to ask, what misconceptions to watch for, and how to tell whether a chart is supporting clear reasoning (or quietly misleading people). Without that specialist focus, issues like unclear encodings, hidden assumptions, or misleading scales can go unchallenged and reduce trust and insight.

Thinking in TEBO terms — and designing with strong visual science, interaction design, and data literacy — elevates data features from "graphs on a page" into tools that help people think. The result is clearer decision-making, fewer "black boxes", and stronger collaboration.

What I Make

Data visualisation & applied tools

I design and build bespoke data visualisations and interactive UI components for organisations and software teams — especially where data is complex, high-dimensional, or difficult to interpret with off-the-shelf charts.

This includes:

  • core charting done properly (clarity, trust, interpretability — not just "charts on a page")
  • custom interaction patterns for exploration and "what-if" reasoning
  • frontend dataviz architecture: reusable components, clean data-flow, performance
  • consultancy on information design and visual decision-making (what to show, how to show it, and why)

I'm comfortable working end-to-end on data-driven features — including the underlying analysis — and collaborating closely with data/backend teams when a visualisation depends on definitions, transformations, or pipeline behaviour. I also work upstream of implementation: clarifying goals with domain experts, surfacing assumptions, and shaping the right visual + interaction model iteratively. Dataviz often succeeds or fails at this stage, and I bring a specialist lens to requirements discovery — ensuring the user's purpose is supported.

Typical stack: TypeScript, React, D3.js, SVG/Canvas/WebGL, Python/SQL (as needed), with close attention to maintainable code and scalable patterns. I'm comfortable with most chart, geoviz, and data libraries.

Learning tools & programmes

Alongside product work, I also design learning tools and programmes that build understanding, confidence, and agency.

Current programmes include:

  • Make Sense — practical, technology-supported sense-making for young people in alternative and non-traditional learning settings
  • Switchplay — football-based data + maths programme combining real activity with simulation and analysis

These tools and experiences are designed to work in real settings: not just "edtech content", but robust interactive tools and activities that support facilitators and learners.

My Story

Why TEBO Studio exists

I didn't come into software through a typical path.

I spent many years as a mathematics teacher, where I became obsessed with a practical question: why do some approaches empower people — and others shut them down?

Teaching gave me a deep foundation in:

  • communication and explanation
  • misconceptions and mental models
  • data literacy and statistical intuition
  • how people actually interpret graphs and abstractions

Later, I moved into software, completed an MSc in learning technologies and computer science, and retrained as a programmer. I began building interactive tools not just as "interfaces", but as ways of thinking.

Since then, I've worked as a frontend and data visualisation engineer and also built founder-led work — notably Switchplay, a football data platform. Across domains (sport, public transport, analytics platforms), the common thread has stayed the same:

building interactive tools that help people make sense of complex systems — and act with agency.

Over time, the tools have changed — from whiteboards to code, from lessons to interfaces — but the thread has stayed the same. In many ways, TEBO Studio is about the tension between change and constancy: how systems evolve over time, and the stable patterns that enable sense-making.

Change & constancy

Playing fiddle as a child in 1988
Playing fiddle in 2025

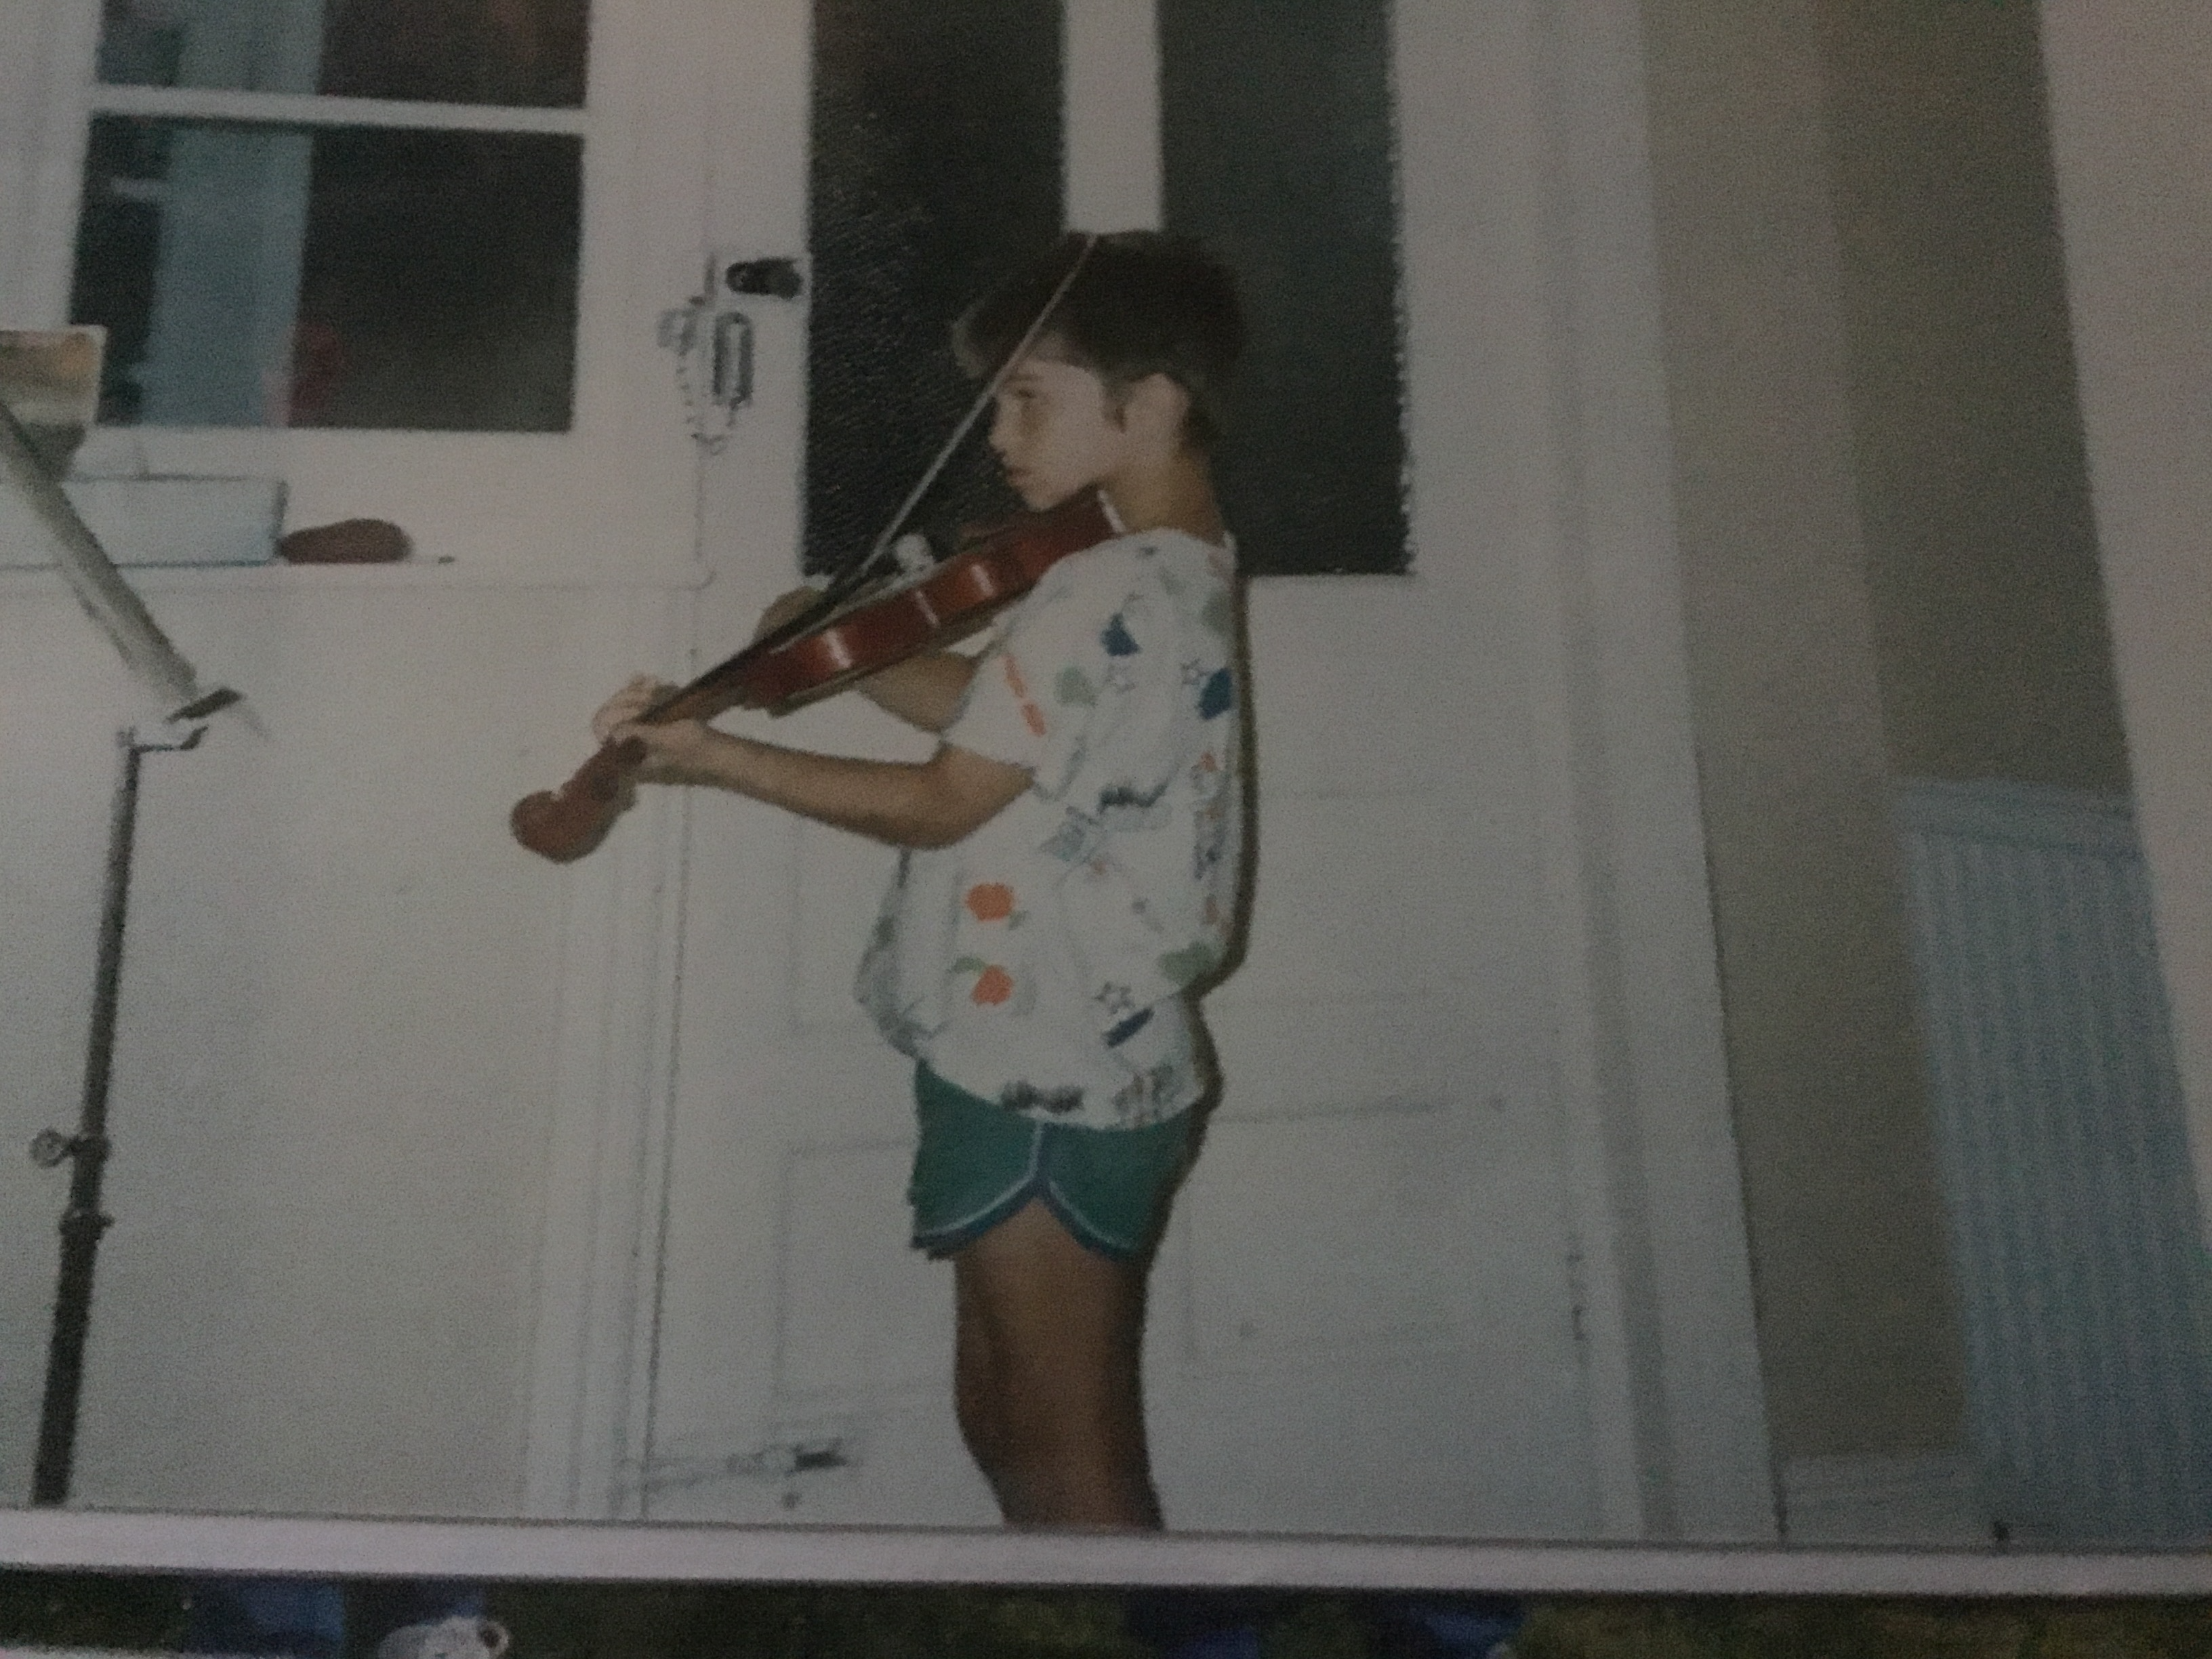
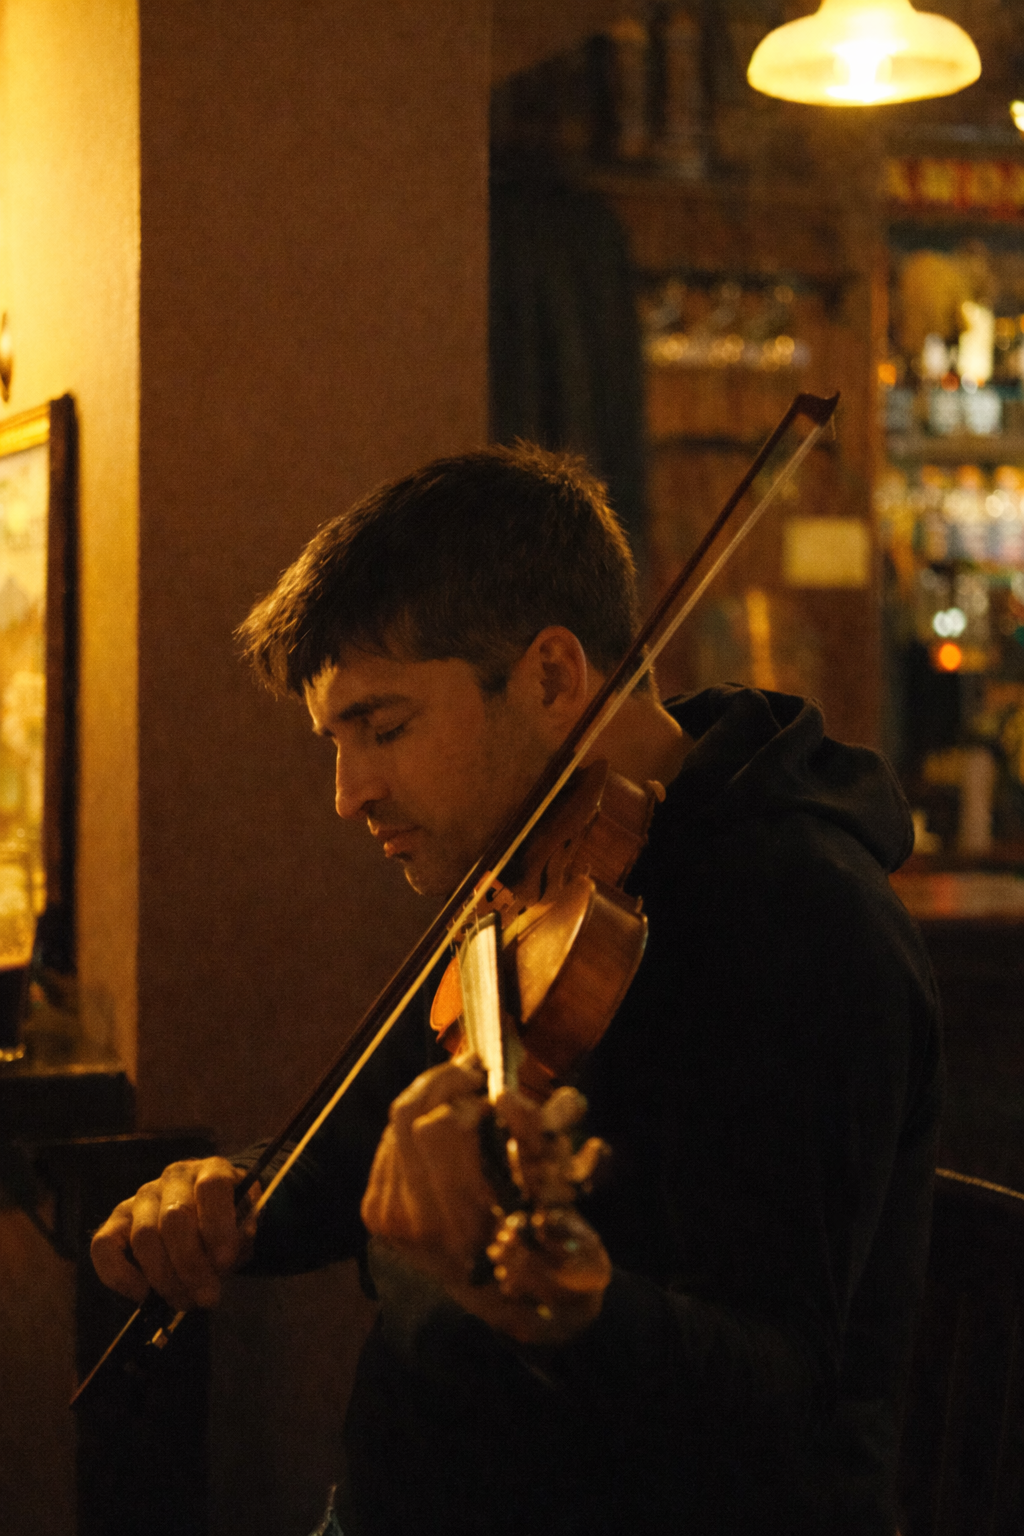
1988 → 2025. Same instrument. Same curiosity. Different life.